 Web Server Statistics for tamagni.org Web Server Statistics for tamagni.org
(Go To: Top: General Summary: Daily Summary: Hourly Summary: Domain Report: Organization Report: Operating System Report: Status Code Report: File Size Report: File Type Report: Directory Report: Request Report)
This report contains overall statistics.
Successful requests: 4,301
Average successful requests per day: 4,302
Successful requests for pages: 4,159
Average successful requests for pages per day: 4,160
Failed requests: 1,410
Redirected requests: 1
Distinct files requested: 332
Distinct hosts served: 501
Corrupt logfile lines: 49
Data transferred: 2.15 gigabytes
Average data transferred per day: 2.15 gigabytes
(Go To: Top: General Summary: Daily Summary: Hourly Summary: Domain Report: Organization Report: Operating System Report: Status Code Report: File Size Report: File Type Report: Directory Report: Request Report)
This report lists the total activity for each day of the week, summed over all the weeks in the report.
Each unit ( ) represents 100 requests
for pages or part thereof.
) represents 100 requests
for pages or part thereof.
day: #reqs: #pages: ---: -----: ------: Sun: 0: 0: Mon: 4301: 4159:Tue: 0: 0: Wed: 0: 0: Thu: 0: 0: Fri: 0: 0: Sat: 0: 0:
(Go To: Top: General Summary: Daily Summary: Hourly Summary: Domain Report: Organization Report: Operating System Report: Status Code Report: File Size Report: File Type Report: Directory Report: Request Report)
This report lists the total activity for each hour of the day, summed over all the days in the report.
Each unit () represents 10 requests
for pages or part thereof.
hour: #reqs: #pages: ----: -----: ------: 0: 193: 190:5: 219: 211:
10: 158: 146:
(Go To: Top: General Summary: Daily Summary: Hourly Summary: Domain Report: Organization Report: Operating System Report: Status Code Report: File Size Report: File Type Report: Directory Report: Request Report)
This report lists the countries of the computers which requested files.
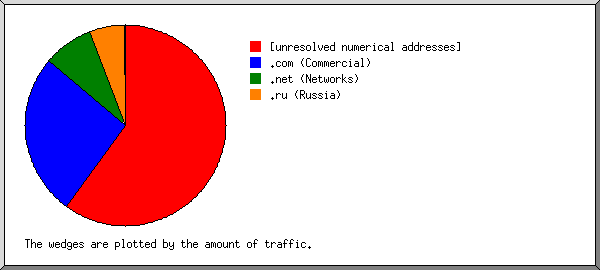
Listing domains, sorted by the amount of traffic.
#reqs: %bytes: domain
-----: ------: ------
 2988: 83.57%: [unknown domain]
 1038:  8.99%: [unresolved numerical addresses]
  181:  5.97%: .com (Commercial)
   25:  0.72%: .de (Germany)
   15:  0.26%: .ru (Russia)
   21:  0.22%: .net (Networks)
    3:  0.09%: .kz (Kazakhstan)
    2:  0.06%: .in (India)
    2:  0.04%: .ae (United Arab Emirates)
    1:  0.03%: .nl (Netherlands)
    1:  0.03%: .edu (US Higher Education)
    2:  0.01%: .vn (Vietnam)
    1:       : .id (Indonesia)
    1:       : [domain not given]
    3:       : .ai (Anguilla)
    5:       : .by (Belarus)
    1:       : .uy (Uruguay)
    1:       : .org (Non Profit Making Organizations)
   10:       : .cz (Czech Republic)
(Go To: Top: General Summary: Daily Summary: Hourly Summary: Domain Report: Organization Report: Operating System Report: Status Code Report: File Size Report: File Type Report: Directory Report: Request Report)
This report lists the organizations of the computers which requested files.
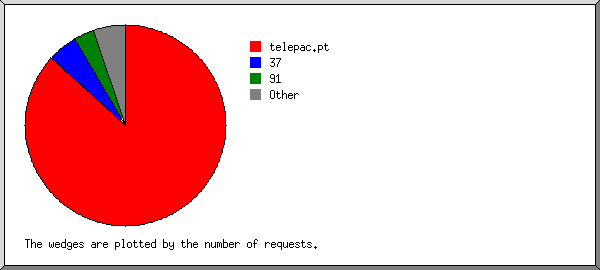
Listing the top 20 organizations by the number of requests, sorted by the number of requests.
#reqs: %bytes: organization
-----: ------: ------------
 2988: 83.57%: [unknown domain]
  667:  0.30%: 77
  100:  2.24%: 45
   83:  1.84%: colocrossing.com
   45:  1.01%: 87
   33:  1.03%: 84
   32:  0.84%: semrush.com
   32:  2.46%: baidu.com
   24:  0.75%: 185.255
   24:  0.72%: vodafone-ip.de
   16:  0.48%: 194.150
   13:       : 43
   11:       : ahrefs.net
   10:       : seznam.cz
   10:  0.15%: 104
    9:  0.48%: googlebot.com
    8:  0.26%: hosted-by-vdsina.ru
    8:  0.55%: 119
    7:  0.22%: 102
    7:  0.16%: 129.146
  174:  2.96%: [not listed: 92 organizations]
(Go To: Top: General Summary: Daily Summary: Hourly Summary: Domain Report: Organization Report: Operating System Report: Status Code Report: File Size Report: File Type Report: Directory Report: Request Report)
This report lists the operating systems used by visitors.
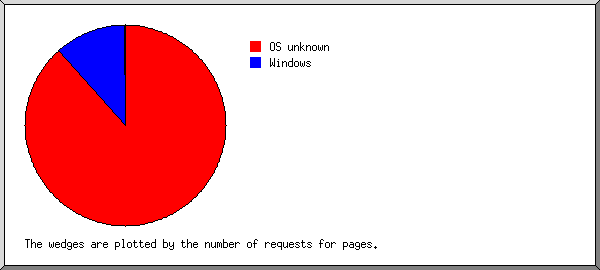
Listing operating systems, sorted by the number of requests for pages.
 #: #reqs: #pages: OS
--: -----: ------: --
 1:  3774:   3745: Windows
  :  2055:   2029:   Windows NT
  :  1719:   1716:   Unknown Windows
 2:   358:    322: OS unknown
 3:    70:     60: Macintosh
 4:    38:     17: Unix
  :    38:     17:   Linux
 5:    61:     15: Known robots
(Go To: Top: General Summary: Daily Summary: Hourly Summary: Domain Report: Organization Report: Operating System Report: Status Code Report: File Size Report: File Type Report: Directory Report: Request Report)
This report lists the HTTP status codes of all requests.
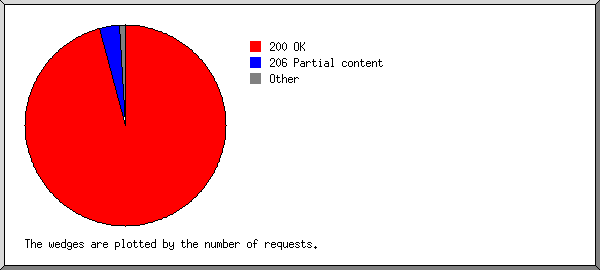
Listing status codes, sorted numerically.
#reqs: status code
-----: -----------
 4280: 200 OK
    1: 301 Document moved permanently
   21: 304 Not modified since last retrieval
 1410: 404 Document not found
(Go To: Top: General Summary: Daily Summary: Hourly Summary: Domain Report: Organization Report: Operating System Report: Status Code Report: File Size Report: File Type Report: Directory Report: Request Report)
This report lists the sizes of files.
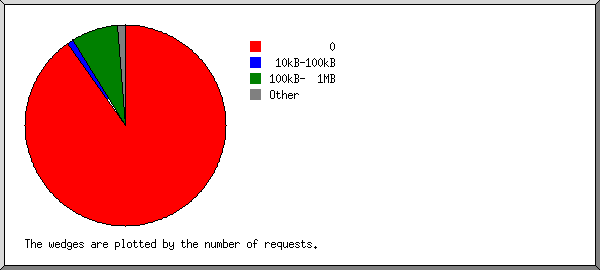
       size: #reqs: %bytes:
-----------: -----: ------:
          0:    22:       :
   1B-  10B:     0:       :
  11B- 100B:    50:       :
 101B-  1kB:    11:       :
  1kB- 10kB:    74:  0.01%:
 10kB-100kB:   722:  0.41%:
100kB-  1MB:  3378: 95.26%:
  1MB- 10MB:    44:  4.32%:
(Go To: Top: General Summary: Daily Summary: Hourly Summary: Domain Report: Organization Report: Operating System Report: Status Code Report: File Size Report: File Type Report: Directory Report: Request Report)
This report lists the extensions of files.
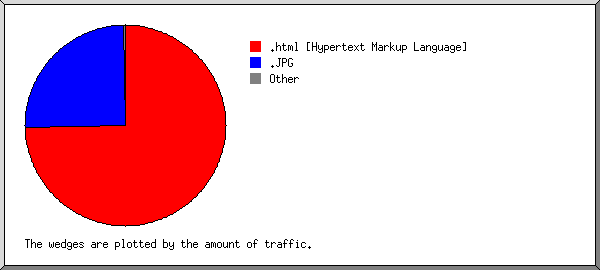
Listing extensions with at least 0.1% of the traffic, sorted by the amount of traffic.
#reqs: %bytes: extension
-----: ------: ---------
 3388: 94.90%: .html [Hypertext Markup Language]
   66:  4.64%: .JPG
  771:  0.31%: [directories]
   26:  0.13%: .db
   50:  0.02%: [not listed: 3 extensions]
(Go To: Top: General Summary: Daily Summary: Hourly Summary: Domain Report: Organization Report: Operating System Report: Status Code Report: File Size Report: File Type Report: Directory Report: Request Report)
This report lists the directories from which files were requested. (The figures for each directory include all of its subdirectories.)
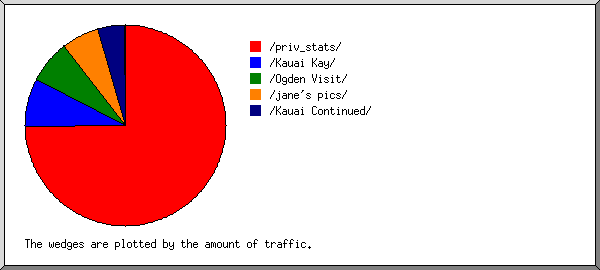
Listing directories with at least 0.01% of the traffic, sorted by the amount of traffic.
#reqs: %bytes: directory
-----: ------: ---------
 4115: 95.10%: /priv_stats/
   24:  1.88%: /Kauai Continued/
   58:  1.45%: /jane's pics/
   17:  1.09%: /Kauai Kay/
    7:  0.30%: /Ogden Visit/
   22:  0.19%: http://
   58:       : [not listed: 3 directories]
(Go To: Top: General Summary: Daily Summary: Hourly Summary: Domain Report: Organization Report: Operating System Report: Status Code Report: File Size Report: File Type Report: Directory Report: Request Report)
This report lists the files on the site.
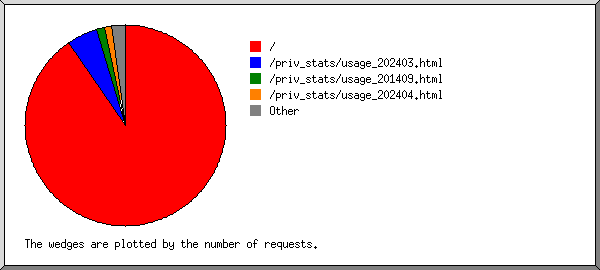
Listing files with at least 20 requests, sorted by the number of requests.
#reqs: %bytes:          last time: file
-----: ------: ------------------: ----
 2897: 82.23%: Jul/20/26 11:59 PM: /priv_stats/usage_202412.html
  690:  0.31%: Jul/20/26 11:42 PM: /priv_stats/
   60:  1.74%: Jul/20/26 11:20 PM: /priv_stats/usage_202607.html
   50:       : Jul/20/26 11:56 PM: /
   36:  1.06%: Jul/20/26 11:54 PM: /priv_stats/usage_201409.html
   29:  0.89%: Jul/20/26 11:42 PM: /priv_stats/usage_202303.html
  539: 13.77%: Jul/20/26 11:58 PM: [not listed: 322 files]
(Go To: Top: General Summary: Daily Summary: Hourly Summary: Domain Report: Organization Report: Operating System Report: Status Code Report: File Size Report: File Type Report: Directory Report: Request Report)


